4. Water availability: National Framework for Water Resources 2025
Updated 20 October 2025
Applies to England and Wales

© Crown copyright 2025
This publication is licensed under the terms of the Open Government Licence v3.0 ����ֱ��. To view this licence, visit or write to the Information Policy Team, The National Archives, Kew, London TW9 4DU, or email: psi@nationalarchives.gov.uk.
Where we have identified any third party copyright information you will need to obtain permission from the copyright holders concerned.
This publication is available at /government/publications/national-framework-for-water-resources-2025-water-for-growth-nature-and-a-resilient-future/4-water-availability-national-framework-for-water-resources-2025
There are several routes for getting access to water, each differing in reliability, cost and regulation.
Figure 16: Access to water – the range of sources available

Figure 16 is a generalisation which shows the different options for access to water, ranging from direct access to water resources from the natural environment to provision of supplies from water companies. It shows that not all water is supplied via water companies and that wider sectors of use will have alternative options for supply. It highlights where regulation enables licensed abstraction to take place, and the importance of recycling and water returned to the environment.
The option a water user takes is usually based on risk, considering accessibility, the level of resilience and reliability needed, and water quality requirements. Factors such as public health or commercial requirements may influence this decision; for instance, a supermarket may stipulate water quality standards for a farm growing salad crops.
With a wide range of uses for water, whether for energy production, food production, carbon capture, peat wetting, navigation, leisure, as well as public water supply, it is vital that water resources planning ensures sufficient and timely investment to secure resilience, particularly given the pressures and uncertainties ahead.
4.1 Water availability: direct abstraction from the water environment
There is already limited water available for new abstractions. This is due to the need to protect existing abstractions and the need to protect the water environment.
The method for calculating nominal water resources availability is explained in Managing water abstraction. The future surface water availability maps consider both Fully Licensed (current abstractors using the full quantity of water on their licence) and a Future Recent Actual abstraction. The future recent actual is calculated from actual abstraction taken over recent years plus predicted growth.
We use colours to represent different surface water availability at a range of flows. Green is where there may be more water than required to meet the needs of the environment. Yellow is where full licensed flows fall below the Environmental Flow Indicator (EFI); if all licensed water is abstracted there will not be enough water left to meet the needs of the environment. Red areas are where recent actual abstraction is causing flows to fall below the EFI.
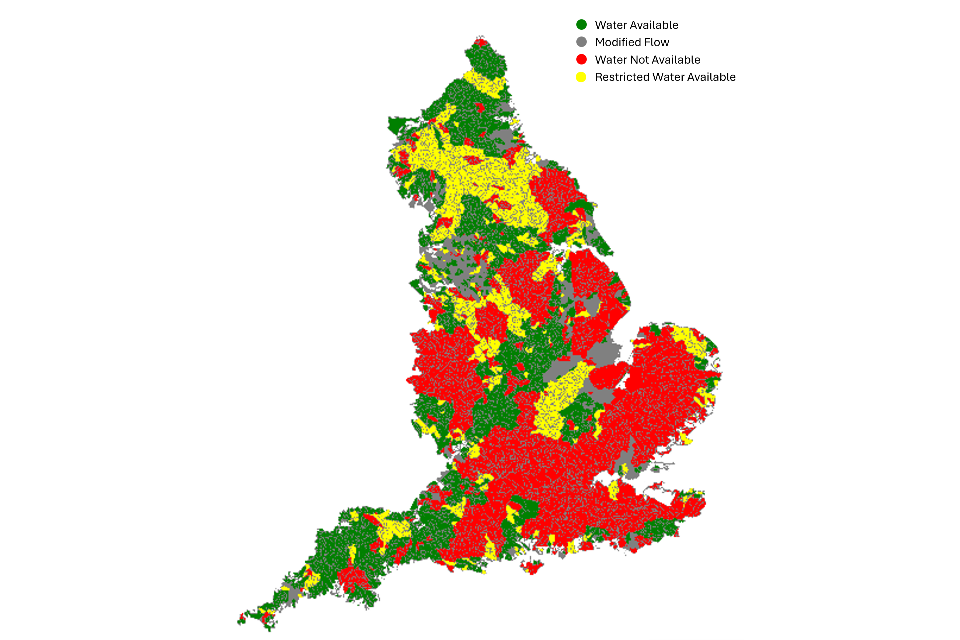
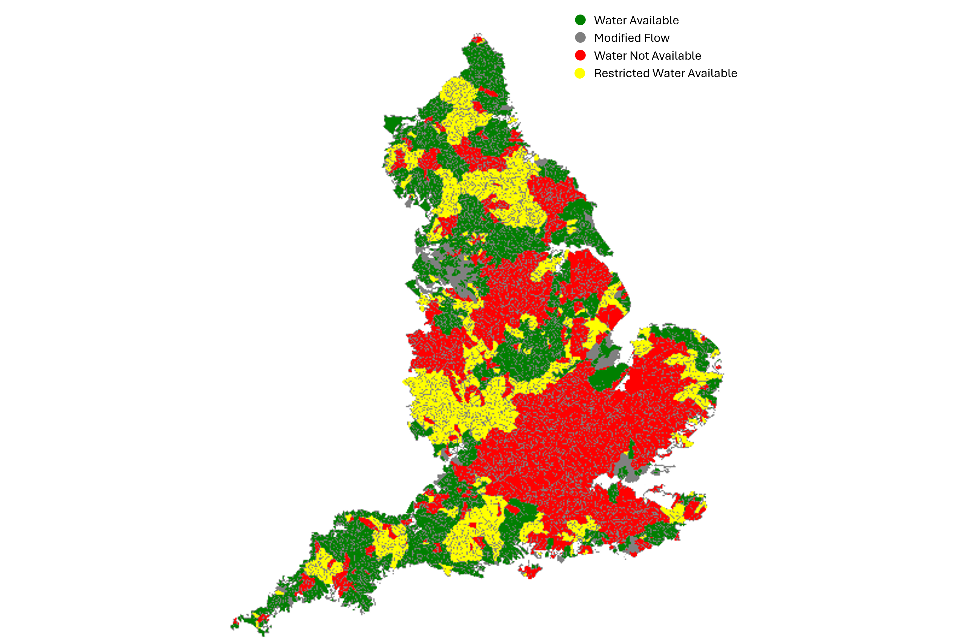
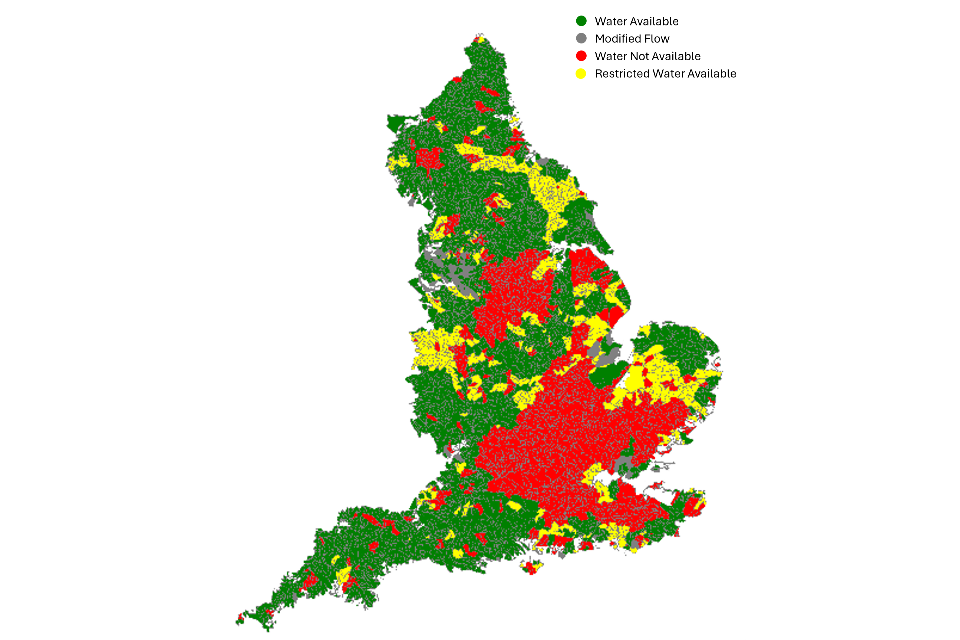
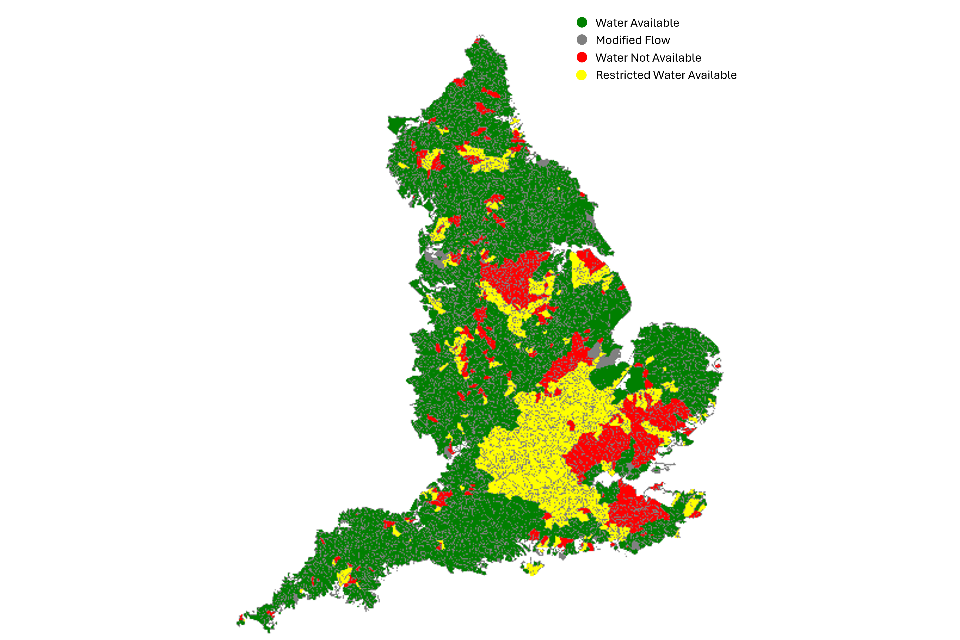
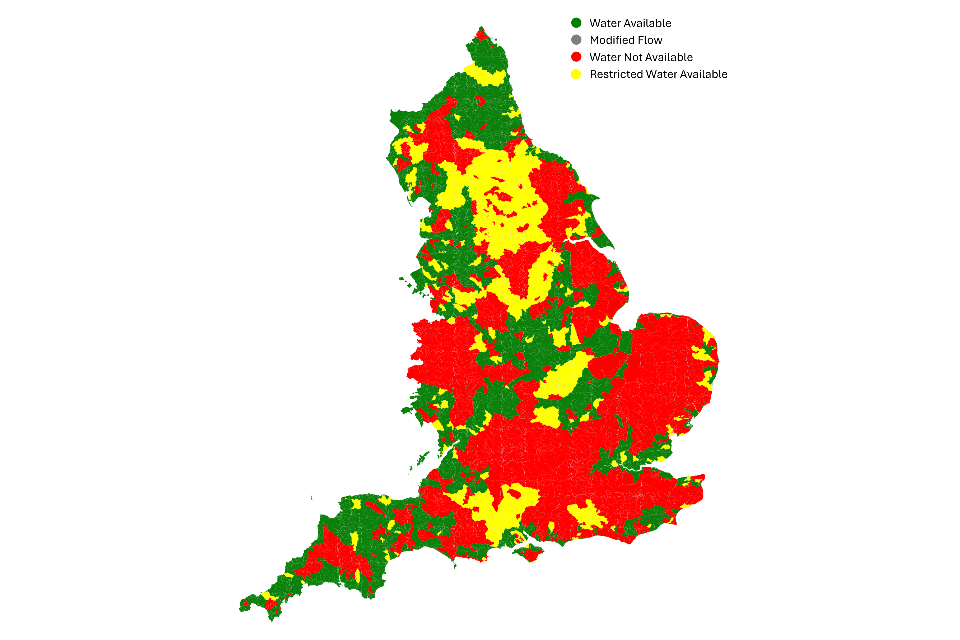
Figure 17: Current potential surface water availability under a range of flow conditions
Low flow (Q95)
Low-medium flow (Q70)
Medium flows (Q50)
Higher flows (Q30)
Data sets on current water availability are accessible and published as open data. They can be found on the . Note that information on the platform is a national dataset and may not reflect local pressures. Any assessment of water availability for abstraction licensing is subject to local assessment and is dealt with on case-by-case basis by the Environment Agency. The relevant abstraction licensing strategy documents available on GOV.UK give more detail on water availability and how we will manage abstraction within each catchment.
Figure 17 shows that under low flows (Q95) there are large areas of the country where there is no water available. Nearly all the South East and East catchments, and large parts of the Midlands are not able to support any new abstractions due to the lack of available water.
It shows that there are some water bodies catchments in the South West, the North and the Midlands that do have nominal amounts of water available for new abstractions. The term ‘nominal’ is used because there will still need to be consideration of local impacts on abstractors and the environment when determining an application for an abstraction licence.
Under higher flows (Q30) there are more catchments that have water available, although many of the South East and East catchments only have limited water availability even under higher flows.
The pressures on water resources will increase. Challenges related to environmentally sustainable abstraction, increasing water demand, and decreasing water availability due to climate change will reduce water availability in the future, or will change the time, location or duration of when it is available.
Groundwater is a valuable resource and provides natural storage. Abstraction from groundwater is often able to increase the resilience of supplies, particularly when used conjunctively with surface water. Sustainable groundwater abstractions in the right locations will be an important resilience option for some sectors such as agriculture. As many of the impacts are not instantaneous, a good understanding of the local groundwater conditions is needed to ensure sustainability.
Figure 18: Future potential surface water availability
Low flow (Q95)
Low-medium flow (Q70)
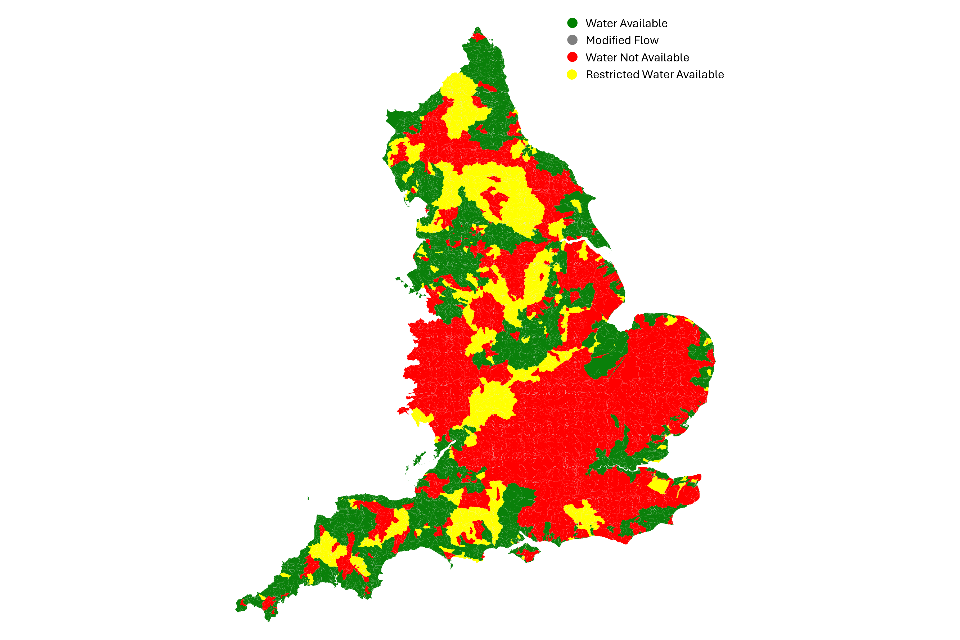
Medium flows (Q50)
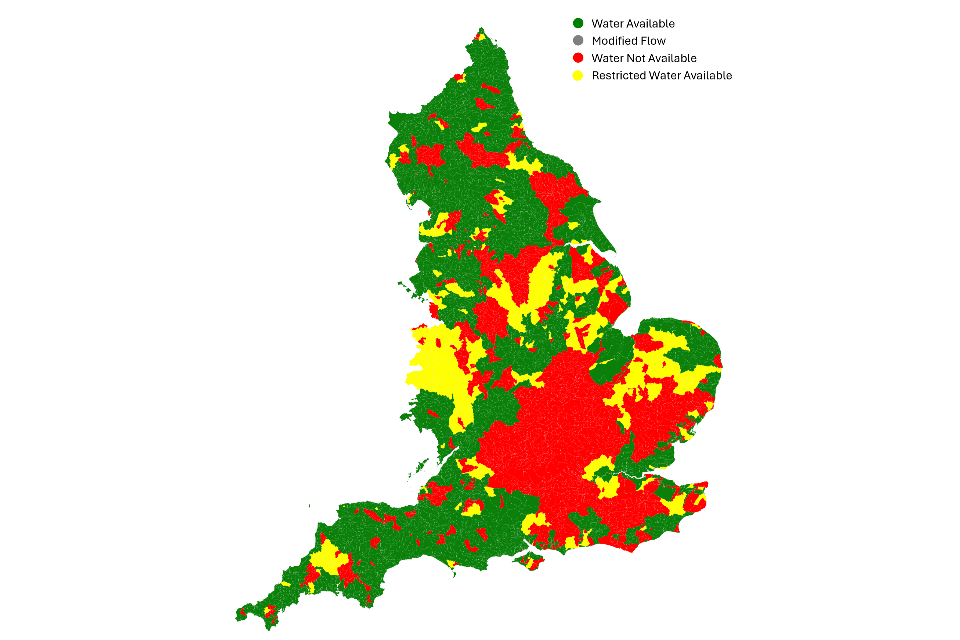
Higher flows (Q30)
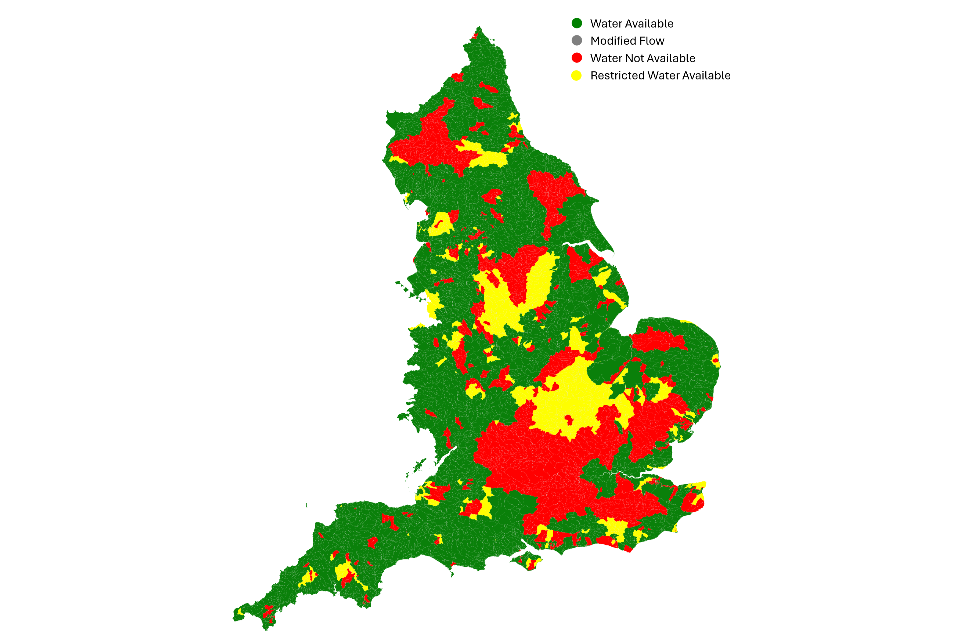
Figure 18 shows the predicted future potential surface water availability in 2050 under the RCM11 climate scenario. Regional Climate Models (RCMs) are typically used to downscale global climate projections to a higher spatial resolution in a physically consistent way, which improves the information available for modelling and planning applications.
Figure 18 shows that in the future under low flows (Q95) and low medium flows (Q70) there are large areas of the country where it is forecast that there is no water available and therefore these catchments would be unable to support any new abstractions. It is predicted that after taking account of existing abstraction and future growth there would be a lack of available surface water across most of the South East and East catchments, and large parts of the West Midlands, and areas within the South West and North East.
Under higher flows there are areas of the country where water may be available for abstraction in the South West, West Midlands, parts of East Anglia and parts of the north of England in the future. It is forecast that there would be no water available for abstraction in many if the catchments in the South East, and parts of the Midlands, East and Northwest. The pattern of water availability is similar under Q50 flows, but less water available for future further abstraction in the midlands and East Anglia.
Figure 19: Current potential groundwater availability
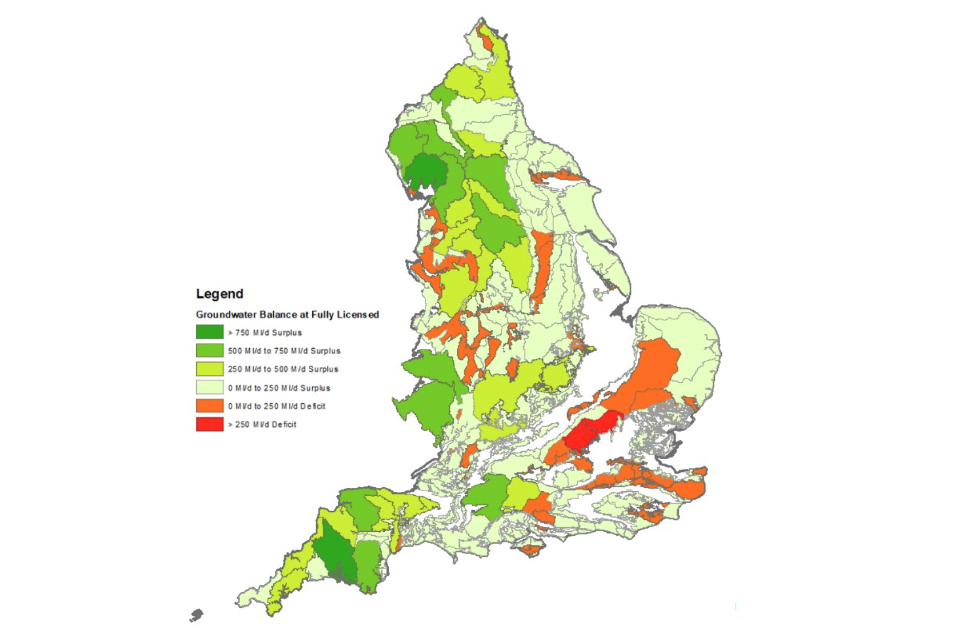
Figure 19 shows the nominal water availability from groundwater using 2019 data. It shows where there is nominally water available for abstraction (surpluses) and where more water is licensed that the average rates of recharge (deficits). It considers average recharge to aquifers, allows for environmental needs, and allocates water to protect the needs of existing licensed abstractions. As with surface water, the term ‘nominal’ is used because there will still be a need to consider local impacts on abstractors and the environment when determining an application for an abstraction licence. The map shows that the main groundwater deficits are in the east and south east of England, with deficits also present in other places including the North West, the northern Midlands and in Yorkshire.
While there will be some reductions in abstraction from groundwater to help improve flows in groundwater-fed streams, this will not result in more water being made available for abstraction. The future natural availability of groundwater is likely to be subject to much greater vulnerability given that hotter, drier periods in summer months may well shorten the recharge season.
Water users looking for new water will need to consider the most environmentally sustainable and efficient options and consider if taking water from the environment (and how it is stored or used conjunctively with other sources) is the best option to provide a secure, reliable sustainable long-term supply.
4.2 Water availability: public water supplies
Water availability from public water supplies is also under pressure. In some parts of England water companies are not accepting requests for new water for non-household supplies.
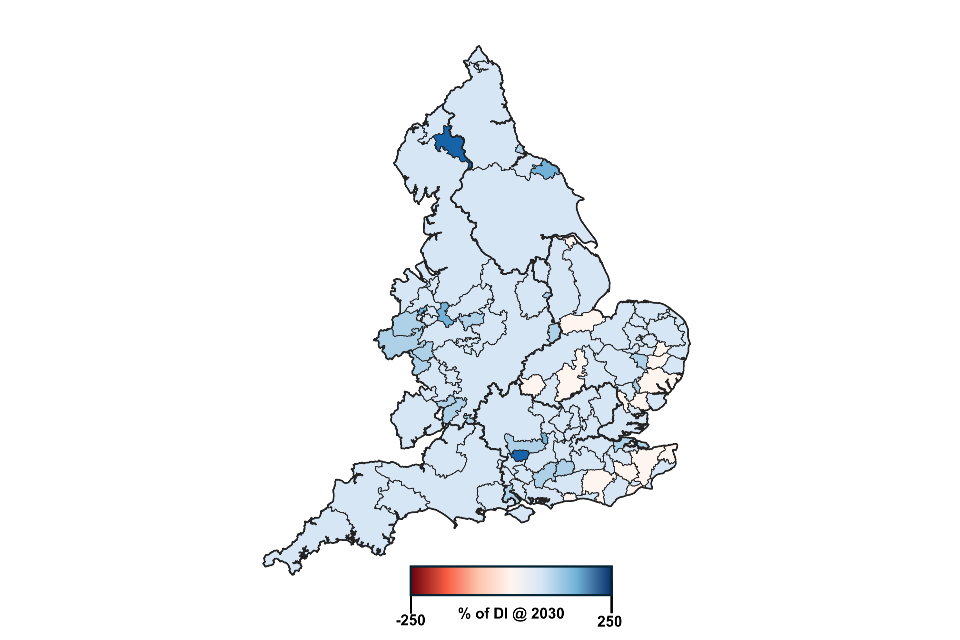
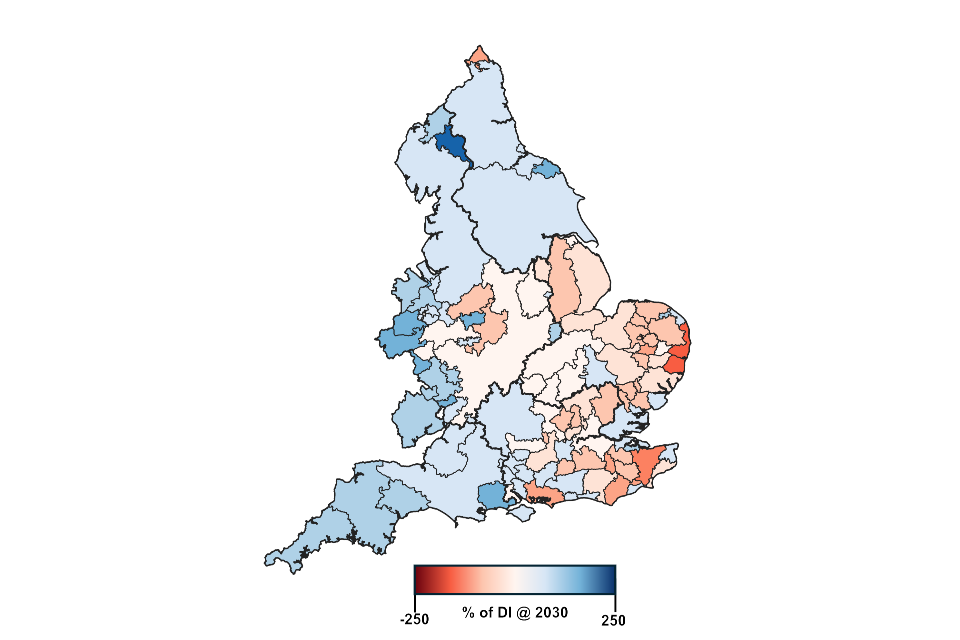
Figure 20: Public water supply water availability, WRMP24 at 2030 and under the Central water needs and Do-Nothing modelling scenarios as a % of DI
WRMP24: 2030
Central: 2055
Do Nothing
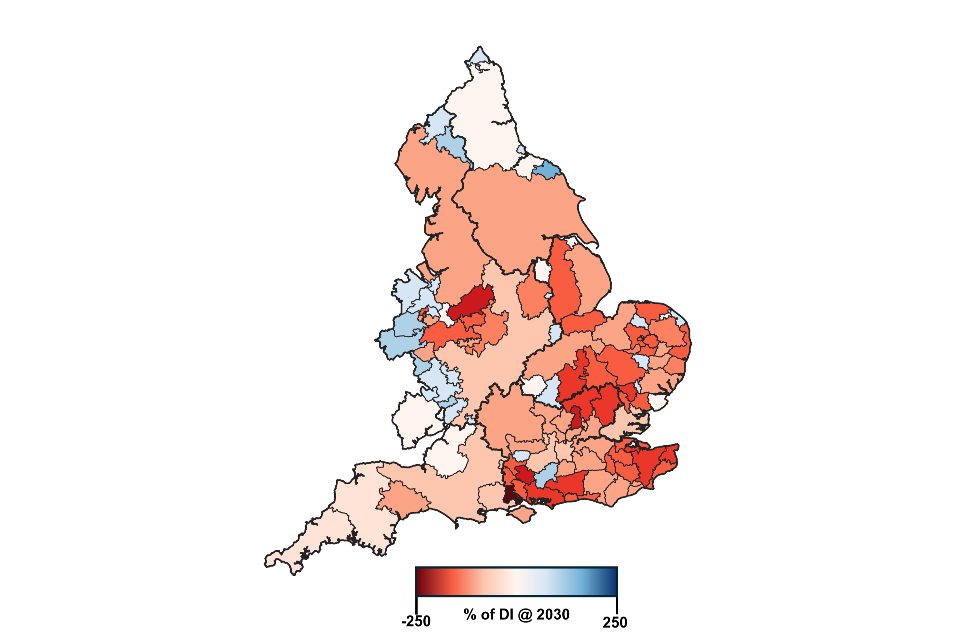
Figure 20 shows the supply demand balance (surplus/deficit) at a Water Resource Zone (WRZ) scale for 2030 WRMP24 (latest available data); 2055 Central scenario; and 2055 Do-Nothing scenario as a percentage of Distribution Input (DI) (which is the amount of water put into a given Water Resource Zone’s supply). Due to the large variation in supply volume of England’s Water Resource Zones, providing the supply/demand balance data as a proportion of a WRZs DI allows us to understand and compare the relative percentage surplus/deficit between the zones.
The 2030 map shows that if water companies deliver the actions over the next 5 years that are set out in the WRMP24 the country would have no water resource zones in deficit. This clearly illustrates the need to ensure the measures planned between now and 2030 are delivered.
By 2055 under the Do-Nothing scenario, it is forecast that there would be supply deficits across much of the country with only a small number of water resource zones that are predicted to have a surplus of water. This demonstrates the needs for action to be taken, demands to be reduced through water efficiency and demand management strategies and supply schemes to be developed to ensure that there is not a future risk to security of supply.
Under the Central scenario, which assumes that the planned WRMP24 supply options have been delivered, and that national demand reduction targets have been met, it is forecast by 2055 that there would be deficits observed in a number of water resource zones in the South East, East and Midlands.
The WRMPs contain a range of different population, housing and development forecasts. However, if growth was to accelerate beyond these scenarios, it may not be planned and accounted for, increasing uncertainty of water availability. Additional action may be required to ensure growth ambitions can be realised.
Next: 5. Taking action